Use the figure below to answer the following questions.
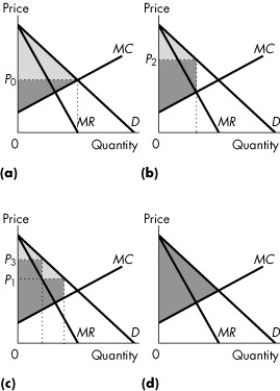
Figure 13.4.4
-Refer to Figure 13.4.4.Consider a market with a monopoly that distinguishes between two groups of buyers.If the light grey area shows the consumer surplus and the dark grey area shows the producer surplus,which graphs correctly represents this firm?
Definitions:
Portfolio Standard Deviation
A statistical measure of the volatility of returns from a portfolio of assets, indicating the degree of investment risk.
Covariances
A measure that indicates the extent to which two variables change together, determining the degree of their correlation.
Expected Return
The weighted average of all possible returns for an investment, with weights being the probabilities of each outcome.
Standard Deviation
A statistical measure of the dispersion of returns for a given security or market index, indicating how much returns can deviate from the average return.
Q7: A market with a single firm but
Q17: The marginal private cost curve (MC)is a
Q76: Jay has an income of $10 to
Q88: Refer to Table 16.3.1.The table shows marginal
Q89: Limit pricing is the practice of<br>A)limiting the
Q90: Initially,a perfectly competitive market that has 1,000
Q93: Refer to Fact 12.4.1.If the price of
Q95: Firm X is competing in an oligopolistic
Q101: Refer to Figure 16.3.1.The figure shows the
Q113: What is the relationship between goods and