Use the figure below to answer the following questions.
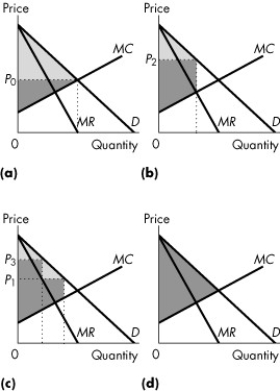
Figure 13.3.2
-Consider Figure 13.3.2. Consider a perfectly competitive market. If the light grey area shows the consumer surplus, and the dark grey area shows the producer surplus, which graph correctly represents this market?
Definitions:
Q4: Refer to Figure 12.4.3 which shows the
Q8: The "tragedy of the commons" refers to<br>A)the
Q32: The key feature of monopolistic competition that
Q34: A firm that is technologically efficient<br>A)always makes
Q35: Refer to Table 16.2.2.If the fertilizer market
Q41: A monopoly<br>A)faces a perfectly elastic demand.<br>B)ignores the
Q59: Betty and Anna work at the same
Q60: If a profit-maximizing monopoly is producing an
Q66: Sixty percent of our air pollution comes
Q66: Refer to Figure 13.2.4.Grannie's is the only