Use the figure below to answer the following question.
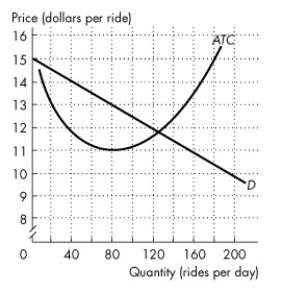
Figure 15.1.1
In the figure, D is the demand curve for taxi rides in a town, and ATC is the average total cost curve of a taxi company.
-Refer to Figure 15.1.1.In the scenario above,the market is:
Definitions:
Q1: A trigger strategy can be used<br>A)in a
Q4: The total product curve is a graph
Q22: Which one of the following goods exhibits
Q22: A cartel is a group of firms
Q53: Refer to Figure 16.2.2.This figure shows the
Q68: Team production is a production process in
Q69: Smoking tobacco creates a _ externality.<br>A)negative consumption<br>B)negative
Q69: The ATC curve shifts upward if<br>A)factor prices
Q92: To maximize profit,a firm hires labour until<br>A)there
Q94: The Hotelling Principle states that<br>A)hotels will tend