Use the figure below to answer the following questions.
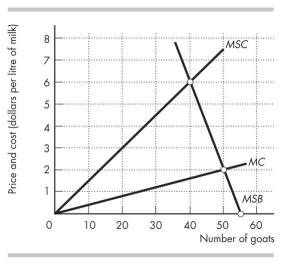
Figure 17.3.2
-Figure 17.3.2 shows the marginal private cost curve, marginal social cost curve, and marginal social benefit curve for raising goats on a common pasture. A quota that results in the common resource being used efficiently is set at
Definitions:
Existing Customers
Individuals or entities that have previously purchased or currently use a company's products or services.
Growth Strategies
Plans implemented by organizations to increase their size, revenue, or market share through diversification, market penetration, product development, or market development.
Ansoff Matrix
A framework used to identify a company’s strategic options for growth by assessing products and markets.
Markov Model
A statistical model that predicts future states based on the current state, often used in machine learning and economic forecasting.
Q5: The unemployment rate is defined as the
Q25: Refer to Figure 16.2.2.This figure shows the
Q32: Refer to Table 21.3.2.From the data in
Q49: Among Canada,Finland,and South Africa,income is distributed most
Q50: According to public choice theory,a voter will
Q61: Canada's anti-combine law is enforced by<br>A)a Competition
Q72: A perfect price-discriminating monopoly is<br>A)less efficient than
Q74: Counting involuntary part-time workers as unemployed would<br>A)not
Q87: Refer to Figure 13.5.1.Suppose the firm is
Q112: The distribution of world income is _