Multiple Choice
Use the figure below to answer the following questions.
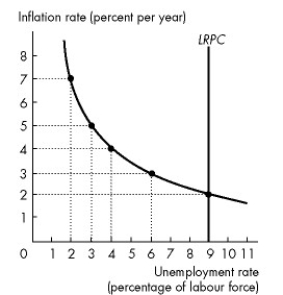
Figure 28.2.2
-Refer to Figure 28.2.2.The figure illustrates an economy's Phillips curves.If the expected inflation rate changes to 3 percent,the
Definitions:
Related Questions
Q16: Suppose the Bank of Canada follows a
Q20: Which of the following organization(s)need to have
Q20: The marginal propensity to save<br>A)equals 1 -
Q29: Government debt is<br>A)equal to revenues minus outlays.<br>B)always
Q32: An increase in the money wage rate
Q33: As you are studying Picture Perfect Painting's
Q40: If the saving function is S =
Q51: Refer to Figure 31.2.1,the tariff _ the
Q93: Refer to Figure 26.3.5.At point B the
Q98: Consumption expenditure minus imports,which varies with real