Essay
The graph in the figure shows the net force acting on a 3.0-kg object as a function of time. 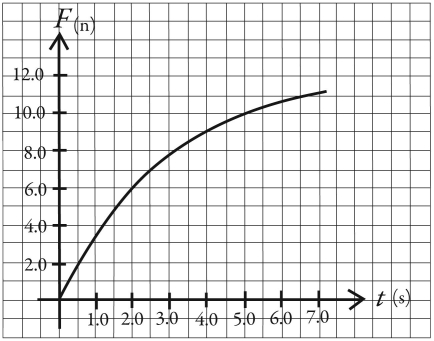 (a) What is the acceleration of this object at time t = 2.0 s?
(b) Draw, to scale, a graph of the acceleration of this object as a function of time over the range t = 0.00 s to t = 7.0 s.
Definitions:
Related Questions
Q1: A car on a roller coaster starts
Q18: A tire is rolling along a road,
Q20: The figure shows an acceleration-versus-force graph for
Q25: When a rigid body rotates about a
Q38: Because the earth's orbit is slightly elliptical,
Q39: The position of an object is given
Q69: A wooden raft has a mass of
Q166: Under the Bretton Woods exchange rate system,
Q251: What determined the exchange rates among currencies
Q254: Refer to Figure 30-6. Which of the