Figure 30-12 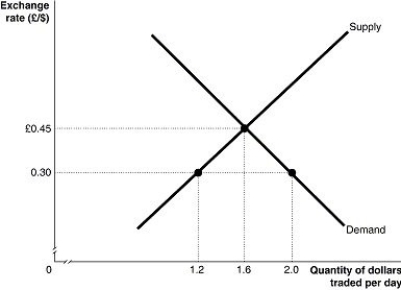
-Refer to Figure 30-12. The graph above, depicts supply and demand for U.S. dollars during a trading day. At a fixed exchange rate of 0.30 pounds per dollar, the dollar is ________ versus the pound. A ________ of the dollar would correct the fundamental disequilibrium that exists in this market.
Definitions:
Q13: A decrease in aggregate demand will<br>A) cause
Q23: A driver in a <img src="https://d2lvgg3v3hfg70.cloudfront.net/TB7476/.jpg" alt="A
Q29: A ball is tossed vertically upward. When
Q39: Since 1999, the U.S. _ account has
Q55: The natural rate of unemployment will not
Q56: Based on the following information, what is
Q74: Refer to Figure 28-1. Suppose that the
Q132: The price level in the economy between
Q193: The current exchange rate system has which
Q203: Refer to Figure 28-2. Suppose the economy