Multiple Choice
Figure 27-11 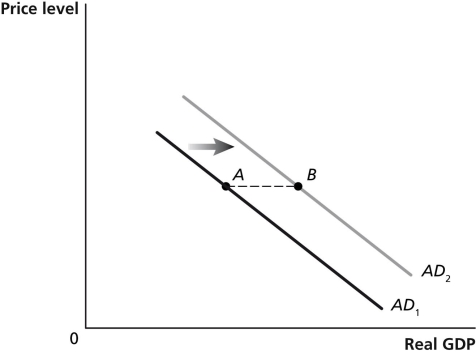
-Refer to Figure 27-11. If government purchases increase by $100 billion and lead to an ultimate increase in aggregate demand as shown in the graph, the difference in real GDP between point A and point B will be
Definitions:
Related Questions
Q17: Between December 2015 and mid-2017, the Federal
Q19: The Fed can directly lower the inflation
Q105: An increase in government purchases of $200
Q139: Calculate the value of the government purchases
Q141: Increases in the price level<br>A) increase the
Q166: With which of the following statements would
Q177: Based on the following information, calculate public
Q207: If the long-run aggregate supply curve is
Q235: Which of the following is an example
Q264: Explain the relationship between net exports and