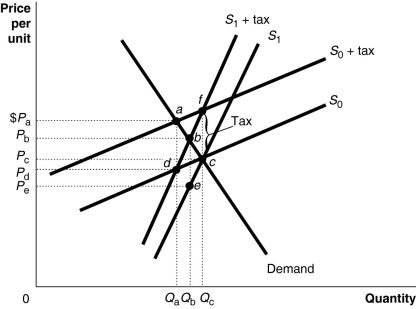
Figure 18-2  Figure 18-2 shows a demand curve and two sets of supply curves, one set more elastic than the other.
-Refer to Figure 18-2. If the government imposes an excise tax of $1.00 on every unit sold, the producer's burden of the tax
Definitions:
Specialization
Focusing on a narrow area of expertise or production, often leading to increased efficiency and productivity in that area.
Current Assets
Assets on a company's balance sheet that are expected to be converted into cash, sold, or consumed within a year or the business's operating cycle, whichever is longer.
Current Liabilities
Short-term financial obligations that are due within one year, indicating the amount a company owes its creditors and others.
Acid Test
A rigorous and conclusive test to prove the effectiveness or value of something, often related to financial solvency.
Q5: Which of the following summarizes the information
Q38: Use the formula for the GDP deflator
Q82: A monopsony restricts the quantity of a
Q105: The town of Saddle Peak has a
Q110: Refer to Figure 18-2. If the government
Q141: Home Depot sells new and used doors
Q142: Which of the following would not be
Q147: When workers are paid on a piece-rate
Q190: Which of the following helps to explain
Q231: Refer to Table 19-28. Based on the