Table 18-12
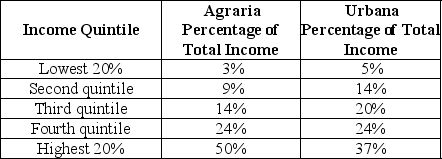
Table 18-12 shows income distribution data for two countries. Use this data to answer the following questions.
-Refer to Table 18-12.
a.Draw a Lorenz curve for each country.
b.Which country has the more equal distribution of income?
c.Based on the Lorenz curves for the two countries, can you determine which country has the more progressive tax system? Explain your answer.
Definitions:
Liabilities
Financial obligations or debts that a company owes to others, which must be paid in the future, such as loans, accounts payable, or mortgages.
Statement of Cash Flows
A financial statement that shows the cash inflows and outflows for a company over a specified period, classified into operating, investing, and financing activities.
Financial Position
The status of the assets, liabilities, and equity of an entity at a given point in time, as outlined on the balance sheet.
Financial Position
A snapshot of the assets, liabilities, and equity of a business at a given point in time, illustrating the company's financial health.
Q2: An average tax rate is calculated as<br>A)
Q18: The law of one price holds exactly
Q18: An example of a final good would
Q22: The income effect of a wage increase
Q43: A study by Price Fishback and Shawn
Q51: When a firm charges $4.95 instead of
Q149: A successful strategy of price discrimination requires
Q151: A commission system of compensation reduces the
Q214: The underground economy can be described as<br>A)
Q221: The marginal productivity theory of income distribution