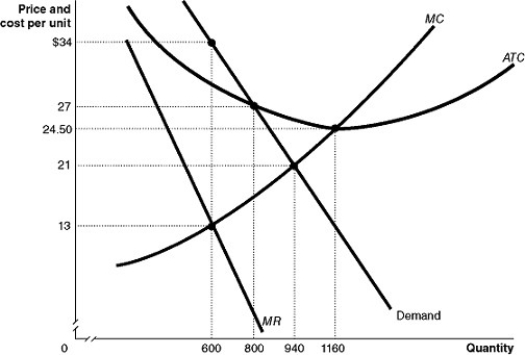
Figure 15-9

Figure 15-9 shows the demand and cost curves for a monopolist.
-Refer to Figure 15-9.What is the difference between the monopoly output and the perfectly competitive output?
Definitions:
Henry George
A 19th-century economist known for his belief that people should own the value they produce themselves, but that land and natural resources should belong to all (Georgism).
Allocative Efficiency
A state of resource allocation in which it is impossible to make any one individual better off without making at least one individual worse off.
Incentive Function
The role of rewards or penalties in motivating individuals or entities to behave in certain ways.
Rationing Function
The ability of market prices to allocate scarce resources among competing uses, ensuring that only those willing and able to pay the price can obtain the good or service.
Q9: Suppose Dublin Electronics charges regular customers $60
Q28: Game theory was developed in the 1940s
Q53: What is a prisoner's dilemma?<br>A) a game
Q70: Refer to Figure 16-5. Suppose the firm
Q99: Collusion is common in oligopoly and monopolistically
Q147: Which one of the following about a
Q194: Consider an industry that is made up
Q237: Draw a graph that shows producer surplus,
Q256: Refer to Figure 15-8. Use the figure
Q259: How will a government-imposed minimum wage affect