Figure 12-17
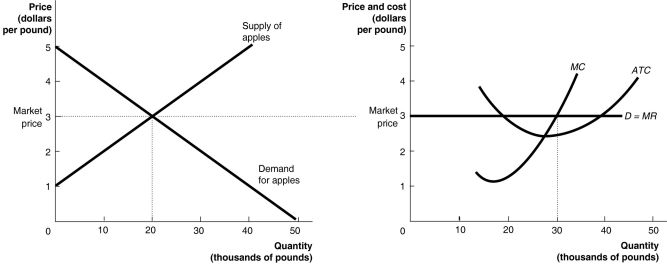
The graphs in Figure 12-17 represent the perfectly competitive market demand and supply curves for the apple industry and demand and cost curves for a typical firm in the industry.
-Refer to Figure 12-17.Which of the following statements is true?
Definitions:
Marginal Utility
The additional utility or enjoyment derived from the consumption of one more unit of a product or service.
Optimal Consumption
The mix of goods and services that maximizes the utility or satisfaction of a consumer given their budget constraint.
Utility
A measure of the satisfaction, usefulness, or pleasure that individuals get from consuming goods and services.
Economics Books
Published works that study the production, distribution, and consumption of goods and services.
Q23: In the United States, the average person
Q64: Carolyn spends her income on popular magazines
Q98: Allocative efficiency is achieved in an industry
Q146: What are economies of scale? What are
Q175: What effect does the entry of new
Q187: Which of the following equations is incorrect?<br>A)
Q188: Lilly Davis has $5 per week to
Q189: A firm could continue to operate for
Q228: Which of the following costs will not
Q311: Refer to Figure 11-11. For output rates