Figure 12-18
-Refer to Figure 12-18.Use the figure above to answer the following questions.
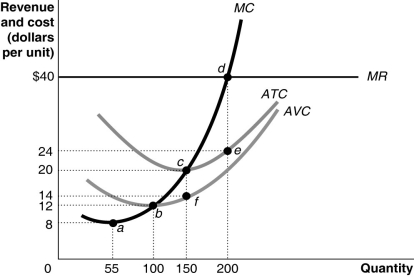
a.How can you determine that the figure represents a graph of a perfectly competitive firm? Be specific; indicate which curve gives you the information and how you use this information to arrive at your conclusion.
b.What is the market price?
c.What is the profit-maximizing output?
d.What is total revenue at the profit-maximizing output?
e.What is the total cost at the profit-maximizing output?
f.What is the profit or loss at the profit-maximizing output?
g.What is the firm's total fixed cost?
h.What is the total variable cost?
i.Identify the firm's short-run supply curve.
j.Is the industry in a long-run equilibrium?
k.If it is not in long-run equilibrium, what will happen in this industry to restore long-run equilibrium?
l.In long-run equilibrium, what is the firm's profit-maximizing quantity?
Definitions:
Normal Model
A type of statistical distribution that is symmetric about the mean, showing that data near the mean are more frequent in occurrence than data far from the mean.
Annual Snowfall
The total amount of snowfall recorded at a specific location over the course of a year.
Unusually Low
Describes values or measurements that are significantly lower than what is typical or expected within a given dataset or situation.
Normal Model
A commonly used probability distribution characterized by its bell-shaped curve, symmetric about the mean and describing many natural phenomena.
Q82: The perfectly competitive market structure benefits consumers
Q95: Increases in the marginal product of labor
Q101: Refer to Figure 13-4. If the firm
Q118: Monopolistically competitive firms achieve allocative efficiency but
Q157: Which of the following statements is true?<br>A)
Q199: To maximize profit, a firm will produce
Q247: Perfectly competitive industries tend to produce low-priced,
Q253: The demand curve for canned peas is
Q260: A constant-cost industry is an industry in
Q293: Firms in perfect competition produce the allocatively