Multiple Choice
Figure 11-13
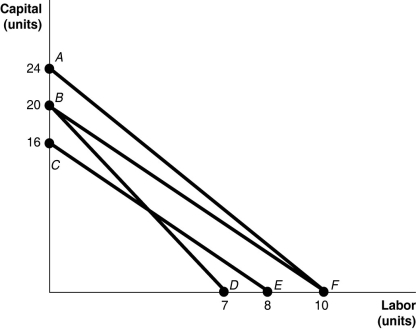
-Refer to Figure 11-13.The lines shown in the diagram are isocost lines.If the price of labor is $50 per unit, then along the isocost AF, the total cost
Definitions:
Related Questions
Q2: Total utility is constant along a given
Q144: A perfectly competitive firm will maximize its
Q198: Use a long-run average cost curve graph
Q200: Explain how the listed events (a-d) would
Q211: If Ewan is consuming his utility maximizing
Q215: Refer to Figure 11-1. The marginal product
Q218: Consider a downward-sloping demand curve. When the
Q259: A Federal Reserve publication proclaimed that "Trade
Q296: Marge buys 5 CDs and 7 DVDs.
Q363: Economists studying the effect of the China