Table 10-5
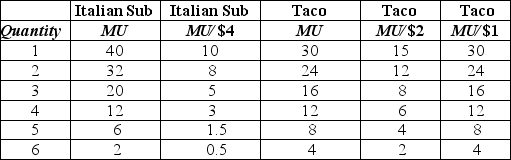
-Refer to Table 10-5, which lists the values of Harry Taber's marginal utility and marginal utility per dollar for Italian submarine (sub) sandwiches and tacos.Assume that the price of a sub sandwich is $4 and the price of a taco is $2.When Harry's income is $14, he buys two Italian sub sandwiches and three tacos.The last column lists the values of the marginal utility per dollar for tacos when the price of a taco decreases to $1.Complete this statement: As a result of the change in price,
Definitions:
Pie Chart
A circular statistical graphic which is divided into slices to illustrate numerical proportions; each slice represents a category's contribution to the whole.
Data Labels
Text or symbols added to charts or graphs in order to identify different data series or categories.
Shading Button
A tool in word processors and graphic design software that applies background color or patterns to selected text, cells, or other elements.
Table Cell
An individual box in a table where a row and column intersect, used to enter and display information.
Q12: Refer to Figure 11-1. The average product
Q39: If Estonia has an absolute advantage in
Q82: The perfectly competitive market structure benefits consumers
Q120: The division of labor and specialization explain<br>A)
Q148: Twenty-eight countries in Europe have eliminated all
Q191: Refer to Table 9-9. Fill in the
Q202: Some online penny auctions charge a fee,
Q236: When plasma television sets were first introduced
Q254: Refer to Figure 11-4. What happens to
Q321: A U-shaped long-run average cost curve implies