Figure 6-9
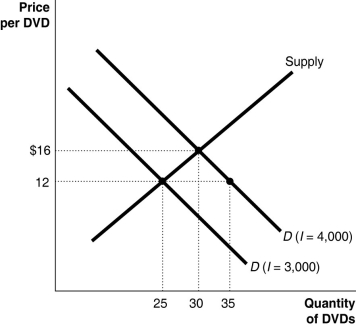
-Refer to Figure 6-9.The data in the diagram indicates that DVDs are
Definitions:
Output
The amount of goods or services produced by a company, sector, or economy.
Fixed Cost
Costs that do not vary with the level of output or production, such as rent, salaries, and insurance premiums.
Average Total Cost
The total cost of production divided by the number of units produced, representing the per-unit cost of production.
Marginal Cost
Indicates the change in total production cost that arises when the quantity produced is increased by one unit.
Q3: Which of the following is one reason
Q46: Consider the following pairs of items: <br>a.
Q53: A product is considered to be excludable
Q66: Applying Coase's theorem, if the cost to
Q98: When there is a negative externality, the
Q181: Refer to Figure 6-12. Suppose the diagram
Q240: If at a price of $10, a
Q253: Refer to Figure 4-3. If the market
Q276: Of the following high-income countries, which has
Q292: In 2016, Philadelphia imposed a tax of