Table 4-10
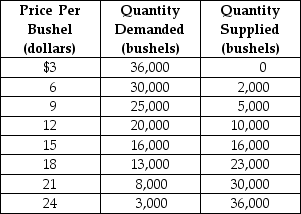 Table 4-10 above contains information about the wheat market. Answer the following questions based on this table.
-Refer to Table 4-10. An agricultural price floor is a price that the government guarantees farmers will receive for a particular crop. Suppose the federal government sets a price floor for wheat at $21 per bushel.
a. What is the amount of shortage or surplus in the wheat market as result of the price floor?
b. If the government agrees to purchase any surplus output at $21, how much will it cost the government?
c. If the government buys all of the farmers' output at the floor price, how many bushels of wheat will it have to purchase and how much will it cost the government?
d. Suppose the government buys up all of the farmers' output at the floor price and then sells the output to consumers at whatever price it can get. Under this scheme, what is the price at which the government will be able to sell off all of the output it had purchased from farmers? What is the revenue received from the government's sale?
e. In this problem we have considered two government schemes: (1) a price floor is established and the government purchases any excess output and (2) the government buys all the farmers' output at the floor price and resells at whatever price it can get. Which scheme will taxpayers prefer?
f. Consider again the two schemes. Which scheme will the farmers prefer?
g. Consider again the two schemes. Which scheme will wheat buyers prefer?
Definitions:
First-In, First-Out Method
An inventory valuation method that assumes goods are sold in the order they are acquired, with the oldest items sold first.
Equivalent Units
A concept in cost accounting used to allocate costs to partially completed units of production, making them comparable to fully completed units.
Conversion Costs
The sum of direct labor costs and manufacturing overhead costs incurred to convert raw materials into finished goods.
Completion Ratios
A measure used to evaluate the extent to which a task, project, or goal has been completed, often expressed as a percentage.
Q47: Refer to Figure 3-8. The graph in
Q53: A product is considered to be excludable
Q130: Compare two situations. (A) A firm is
Q135: Some policymakers have argued that products like
Q176: A demand curve shows the relationship between<br>A)
Q177: Refer to Figure 4-18. As a result
Q178: An increase in the price of MP3
Q224: A demand curve shows<br>A) the willingness of
Q254: Refer to Figure 5-16. Suppose Amit and
Q329: If Uber is required to start paying