Figure 3-8 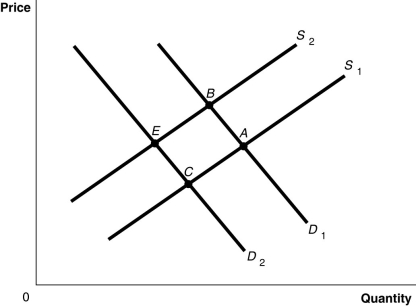
-Refer to Figure 3-8. The graph in this figure illustrates an initial competitive equilibrium in the market for apples at the intersection of D1 and S1 (point A) . If there is a shortage of apples, how will the equilibrium point change?
Definitions:
Time-Value
The idea that having money now is more valuable than having the same sum in the future because of the potential to earn more over time.
Discounting
The process of determining the present value of a payment or a stream of payments that is to be received in the future.
Compounding
The process whereby interest is added to the principal sum, so that from that moment on, the interest that has been added also earns interest.
Demand Curve
A graph representing the relationship between the price of a good and the quantity demanded, with price on the vertical axis and quantity on the horizontal axis.
Q25: Assume that both the demand curve and
Q40: Suppose your expenses for this term are
Q41: Assume that both the demand curve and
Q59: Refer to Table 3-4. The table above
Q85: If a country produces only two goods,
Q112: A change in all of the following
Q259: Refer to Table 3-3. The table above
Q401: Refer to Figure 2-5. If the economy
Q409: Refer to Figure 3-4. If the price
Q442: The law of demand implies, holding everything