Multiple Choice
Figure 3-8 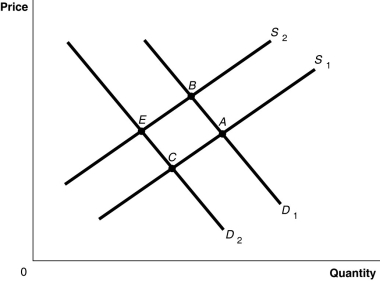
- Refer to Figure 3-8. The graph in this figure illustrates an initial competitive equilibrium in the market for motorcycles at the intersection of D2 and S1 (point C) . Which of the following changes would cause the equilibrium to change to point B?
Definitions:
Related Questions
Q20: An increase in the demand for LED
Q29: Suppose the demand curve for a product
Q47: Refer to Figure 3-8. The graph in
Q91: Refer to Figure 2-8. Suppose Vidalia is
Q177: Refer to Table 3-4. The table above
Q238: If a country produces only two goods,
Q287: Refer to Table 2-25. This table shows
Q431: Explain the difference between a normal good
Q455: An inferior good is a good for
Q457: If the price of propane-fueled gas grills