Figure 2-4 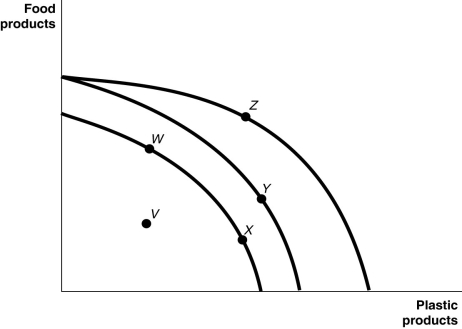 Figure 2-4 shows various points on three different production possibilities frontiers for a nation.
-Refer to Figure 2-4. Consider the following movements:
a. from point V to point W
b. from point W to point Y
c. from point Y to point Z
Which of the movements listed above represents economic growth?
Definitions:
Q86: On a diagram of a production possibilities
Q161: Refer to Table 2-10. Which of the
Q174: Refer to Figure 3-8. The graph in
Q183: The payment received by suppliers of entrepreneurial
Q195: Individuals who have never been the best
Q281: An increase in population shifts the production
Q302: The income effect explains why there is
Q333: Refer to Table 2-31. This table shows
Q347: Refer to Table 2-1. Assume that Tomaso's
Q439: Select the phrase that correctly completes the