Use the figure below to answer the following question(s) .
Figure 4-8 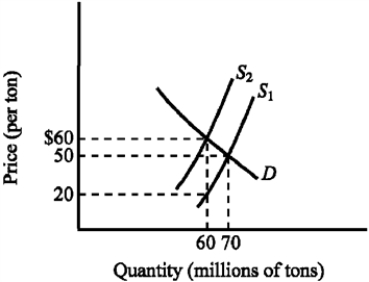
-Refer to Figure 4-8. The supply curve S1 and the demand curve D indicate initial conditions in the market for soft coal. A $40-per-ton tax on soft coal is levied, shifting the supply curve from S1 to S2. Imposing the tax increases the equilibrium price of soft coal from
Definitions:
Q20: Refer to Figure 4-22. The effective price
Q32: Suppose external benefits are present in a
Q34: Suppose that a tax is placed on
Q93: Government programs such as Medicare substantially subsidize
Q94: A politician may be considered an entrepreneur
Q135: Which of the following contributed to the
Q182: If the demand for a good is
Q189: Refer to Figure 3-18. Which area represents
Q204: When the price of a good falls,
Q266: Refer to Figure 4-9. The market for