The figure below is from an experiment on athletes. The "live high, train low" group lived for 18 days in rooms with a simulated altitude of 3,000 m, while training (exercising) at 1,200 m. Use this information and this figure to answer the following questions. 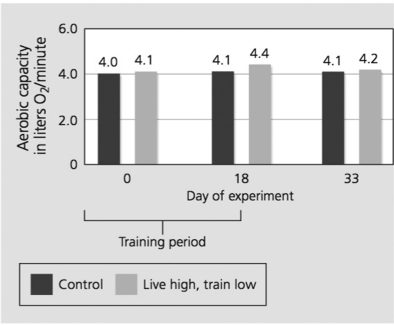
-The scientists who conducted this experiment were testing the hypothesis that living at high altitudes will boost red blood cell production, which can then affect stamina when training and competing at lower altitudes. Why did they measure the athletes' aerobic capacity, which is the maximum amount of oxygen used in one minute per kilogram of body weight?
Definitions:
Descriptive Statistics
Descriptive statistics consist of methods for summarizing and organizing data, such as measures of central tendency and variability, to describe its main features.
Inferential Statistics
The branch of statistics that focuses on drawing conclusions about a population based on a sample taken from it, usually through hypothesis testing or estimation.
Example
An instance or case that is representative of a concept or demonstrates a particular situation or principle.
Net Present Value
A financial metric used to evaluate the profitability of an investment, calculated by subtracting the present value of cash outflows from the present value of cash inflows over a period.
Q10: An atom with an electrical charge is
Q21: In suburban areas with a high density
Q25: Amino acids include a side group as
Q26: Which group of mice would have a
Q38: In this figure, what could one of
Q39: Why might this changing population structure be
Q53: How does RNA differ from DNA?<br>A)RNA is
Q54: What do cytotoxic T cells identify and
Q54: Which type of tissue stores fat in
Q62: Oats are eaten by humans as oatmeal