The figure below is from an experiment on athletes. The "live high, train low" group lived for 18 days in rooms with a simulated altitude of 3,000 m, while training (exercising) at 1,200 m. Use this information and this figure to answer the following questions. 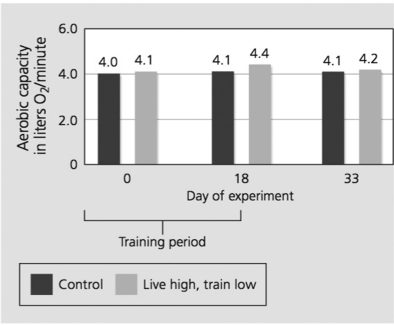
-What does the graph show about the experiment?
Definitions:
Q14: By definition, what type of fatty acid
Q18: According to the diagram _.<br>A)secretions from the
Q29: Plasma is where we could find _
Q32: For a plant, carbon and nitrogen are
Q35: Based on the relationship between Plasmodium spp.
Q39: How old are these trees?<br>A)3.5 years old<br>B)7
Q42: Sustainable development _.<br>A)will require making difficult decisions
Q51: In what part of the ocean are
Q59: What action might increase the number of
Q65: To allow rapid diffusion between the body