Multiple Choice
The graph in the figure shows the tensile stress as a function of the tensile strain in a certain wire. What does the slope of this graph give us for this wire? 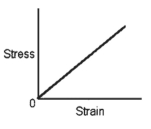
Definitions:
Related Questions
Q5: A car traveling at a steady 20
Q7: The figure shows a famous roller coaster
Q27: A small car meshes with a large
Q28: A puck moves on a horizontal
Q41: A golf club exerts an average horizontal
Q61: A 1000-kg whale swims horizontally to the
Q63: The L-shaped object shown in the figure
Q73: An object moves in a circular path
Q76: Find the magnitude and direction of
Q184: An ideal gas occupies 6.00 × 10<sup>2</sup>