The graph in the figure shows the position of a particle as a function of time as it travels along the x-axis.
(a)What is the magnitude of the average velocity of the particle between t = 1.0 s and t = 4.0 s?
(b)What is the average speed of the particle between t = 1.0 s and t = 4.0 s? 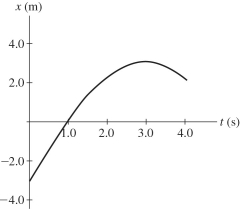
Definitions:
Price-Searcher Firm
A company that operates in a market with differentiated products and has some control over the price of its product because it faces a downward-sloping demand curve.
Profit Maximization
is the process or strategy by which a firm adjusts its production and sale levels to achieve the highest possible profit.
Price Takers
Firms or individuals who accept the market price as given and have no influence to change it.
Product Variety
The range of different goods or services offered by a company or available in a market.
Q17: An object moving in the +x direction
Q29: The figure shows two boxes, with
Q53: Which of the following graphs represent an
Q69: A ball rolls over the edge of
Q77: A hockey puck slides off the edge
Q91: Vector <span class="ql-formula" data-value="\overrightarrow {
Q100: A light-year (ly)is the distance that light
Q129: A projectile is fired from ground
Q132: A hunter points a rifle horizontally and
Q179: A plane has an airspeed of 142