The graph in the figure shows the velocity of a particle as it travels along the x-axis. (a)In what direction (+x or -x)is the acceleration at t = 0.5 s?
(b)In what direction (+x or -x)is the acceleration at t = 3.0 s?
(c)What is the average acceleration of the particle between t = 2.0 s and t = 4.0 s?
(d)At what value of t is the instantaneous acceleration equal to 0 m/s2? 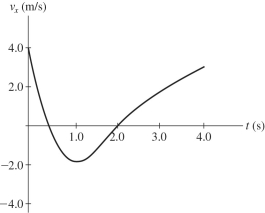
Definitions:
Historical Analogy
Historical Analogy involves using historical events as a reference to understand and predict future or current events, based on assumed similarities.
Forecasting
The process of making predictions about future events based on historical and current data using statistical methods and analysis.
Explanatory Models
Theoretical frameworks or models used to explain how or why a certain phenomenon occurs, often used in scientific research.
Causal Models
Analytical models used to study the cause-effect relationships between variables within a system.
Q1: Two packages are connected by a very
Q1: You push on box G that is
Q14: The components of vectors <span
Q15: The graph in the figure shows the
Q25: A box is placed on a table
Q58: A reasonable estimate for the duration of
Q63: Add <span class="ql-formula" data-value="1299 \mathrm
Q65: A 400-kg box is lifted vertically upward
Q142: A celebrating student throws a water balloon
Q171: A vector in the xy-plane has an