The table below contains short run average cost data for five different plant sizes for C3PO Technologies Ltd.
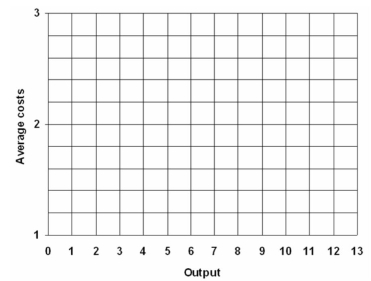
a) On the grid in the figure below, graph the short-run average cost curves for the five plants.  b) What is the right-size of plant for each of the following output levels: 2, 4, 6, 8 and 10?
c) Do a sketch of the long-run average cost curve in the graph above.
d) What plant size would C3PO need to use in order to achieve MES?
e) If C3PO is producing an output level of 6 in plant size 4, does excess capacity exist?
Definitions:
Slide Show
A presentation of a series of images or pages, often advanced automatically or controlled manually.
Create Pages
The act of generating new pages within a software application or document, often to add content or structure.
Physical Notebook
A physical notebook is a book or binder of paper pages used for recording notes, drawings, or keeping information organized in a tangible format.
Excel Worksheet
A single spreadsheet within an Excel file, consisting of cells arranged in rows and columns.
Q15: What do products such as household electricity,
Q23: In many countries, income earned from financial
Q48: If cross-elasticity of demand is positive, we
Q50: The role of financial markets is to:<br>A)
Q56: If the MU per dollar spent on
Q64: What are the four strengths of a
Q84: Refer to the information above to answer
Q94: What do economists consider the true cost
Q136: What does the term non-excludable mean?<br>A) It
Q168: What might cause the MC curve to