Multiple Choice
The graph below shows the supply and demand for tickets to a Raptors basketball game.
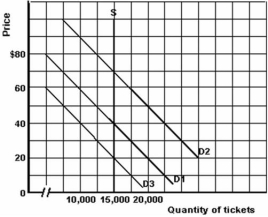
-Refer to the graph above to answer this question.Which of the following statements is correct regarding the change in the demand curve from D1 to D2?
Definitions:
Related Questions
Q2: Refer to the above information to answer
Q48: Refer to the above graph to answer
Q54: Refer to the information above to answer
Q79: Assume that the market for jeans is
Q80: Refer to the graph above to answer
Q91: Refer to the information above to answer
Q105: Which of the following statements is true
Q109: Total product and total output are the
Q147: Refer to the graph above to answer
Q162: The price elasticity of demand coefficient is,