Multiple Choice
Below is a graphical illustration of a typical firm operating in a monopolistically competitive industry:
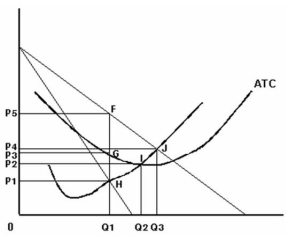
-Refer to the graph above to answer this question.What area graphically represents a profit-maximizing firm's total revenue?
Definitions:
Related Questions
Q34: Assume the market for apple pie is
Q60: Refer to the information above to answer
Q89: A decrease in supply causes the price
Q98: What is the term for those products
Q111: Refer to the above information to answer
Q114: Which of the following is true?<br>A) A
Q122: All of the following except one are
Q140: Joseph Schumpeter argued that the engine of
Q162: Differentiate between a fair-return price and a
Q177: Refer to the above graph to answer