The following graph shows the costs and revenues of a typical firm operating in a monopolistically competitive industry.
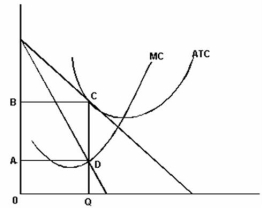
-Refer to the graph above to answer this question.Which of the following will be the result of the situation illustrated in the graph?
Definitions:
Control Group
In an experiment, the group of participants who are not exposed to the independent variable, used as a comparison to measure the effect of the treatment.
Experimental Group
The group in an experiment that receives the variable being tested, allowing researchers to determine the effect of that variable.
Human Laboratory Studies
Research experiments conducted in controlled environments on human subjects to study behavior, reactions, or biological processes.
Generalizability
The extent to which findings or conclusions from a study can be applied to broader contexts beyond the study settings or subjects.
Q18: All of the following except one are
Q51: Refer to the diagram above to answer
Q89: Refer to the graph above to answer
Q93: Refer to the above information to answer
Q104: The home appliance, automotive, brewing and computer
Q108: Gwen had only $10 yesterday. She was
Q111: Refer to the table above to answer
Q137: Refer to the above information to answer
Q141: Refer to the graph above to answer
Q162: Refer to the graph above to answer