The first graph below is for Chic and Sharpe Ltd., a firm in the women's garment industry, which is monopolistically competitive.
a) Label the four curves in the first graph. 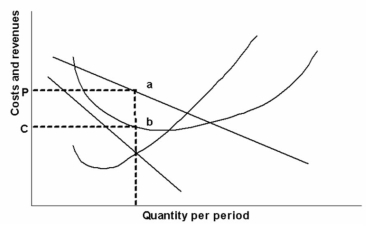
b) What areas in the graph above represent: total cost: total revenue; and economic profit?
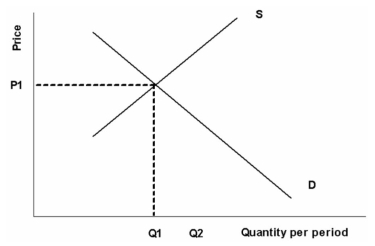
c) On the second graph below, sketch in the effect of entry by new firm's into this industry and label the new price and quantity traded as P2 and Q2
d) Using the average/marginal cost curves in the third graph below, sketch in the firm's new demand and marginal revenue curves that would be consistent with zero economic profits. Label the equilibrium price and quantity traded as P2f and Q2f
e) On the third graph indicate with Qc the capacity output for the firm.
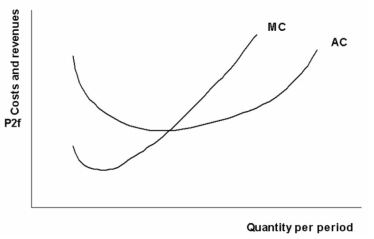
f) What is the amount of excess capacity for this firm?
Definitions:
Required Discount Rate
The minimum expected rate of return on an investment, used in the discounting process of present value calculations.
Profitability Index
A financial tool used to determine the desirability of an investment or project by dividing the present value of future cash flows by the initial investment cost.
Rate Of Return
The gain or loss on an investment over a specified time period, expressed as a percentage of the investment's initial cost.
Q14: Rocks subjected to relatively high temperatures are
Q27: Which of the following statements about the
Q38: All of the following are stresses capable
Q41: Fission- track dating is accomplished by observing
Q70: Refer to the above graph to answer
Q78: John Kenneth Galbraith is known for his
Q99: "The loss of profits resulting from higher
Q107: Distinguish between the European Union (EU) and
Q161: What is the name for a market
Q172: A monopolist is free to charge any