The following graph shows the production possibilities for the economy of Esher: 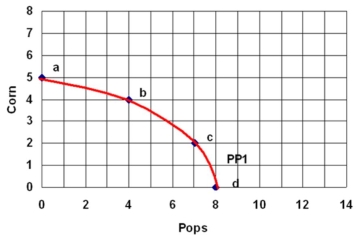 a) What is the total cost of producing 7 pops?
b) What is the total cost of producing 4 corns?
c) What is the cost of moving from point b to point c?
Suppose that Esher experiences a 50% increase in the productivity of producing Pops.
d) Draw in the new production possibilities curve labelled PP2.
e) If Esher wants to have 6 pops, how many corn can it now have?
Definitions:
Q4: An atom with only one electron in
Q4: If a volcano has not erupted in
Q23: Why is asbestos so dangerous?
Q27: Explain why the crystals of any given
Q38: Acid rain has a pH value of
Q91: Explain why an increase in nominal wage
Q110: The figure below illustrates the demand for
Q113: What is meant by barriers to entry?
Q147: Refer to the graph above to answer
Q148: What is the difference between a factor