Use the following information to answer the question. Data and summary statistics about college professor's salaries was gathered from nine institutions and is presented below. This salary information is from professors teaching at the Master's level.
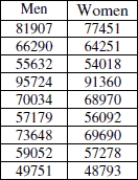

 Men: x = 67691; s = 14506 Women: x = 65323; s = 13274
-Which group has more variability? How would this affect the histogram for the group, compared to the other group? Explain.
Definitions:
Q5: The scatterplot below shows the ice cream
Q6: Approximately how many trips would you expect
Q6: To continue the study, the shop owner
Q8: Which of the following statements is true
Q13: Overall, what percentage of the sample supports
Q22: The distribution of the numbers of times
Q24: An economist conducted a hypothesis test to
Q26: Choose the correct null and alternative hypothesis
Q33: Choose the statement that correctly explains why
Q72: The figure above shows supply curves for