Multiple Choice
According to the data presented in the graph, between 1960 and 2000, CO 2 levels rose approximately__________ ppm. 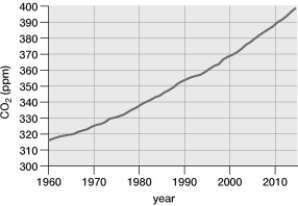
Definitions:
Related Questions
Q2: Kin selection refers to<br>A) determining which related
Q2: Which of the following does NOT represent
Q11: Where is glycogen stored in vertebrate animals?<br>A)
Q33: How do animals identify their territories?
Q40: In a deciduous oak forest in the
Q46: Trial-and-error learning can be important in the
Q50: The tissue shown in the photograph forms
Q59: What methods do animals use to communicate
Q66: Cartilaginous fishes lack gills in their adult
Q73: Worker honeybees are<br>A) sterile males.<br>B) sterile females.<br>C)