Use the following pair of graphs, which illustrate the market for corn which is used to produce corn-based ethanol) and a representative firm, to answer the following questions.
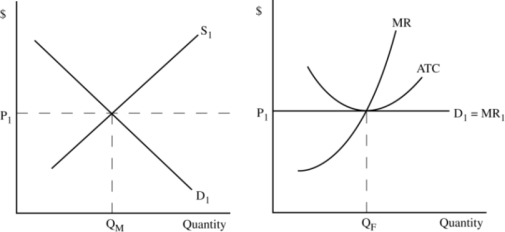 Figure 7.1
a. Assume policymakers pass a law requiring that all gas sold in the United States contain at least 10 percent corn-based ethanol. In the graphs above, illustrate the short-run effects of this law. In particular, show how the law would affect
• the short-run equilibrium in the market for corn,
• the short-run demand curve faced by the representative firm, and
• the representative firm's short-run profit-maximizing level of output. Label the new curves and equilibrium values using a subscript 2.
b. Next, graphically illustrate how, after the initial changes you illustrated in question 7, the corn market and the representative firm would adjust back to long-run equilibrium. Label any new curves and equilibrium values using a subscript 3. After all adjustments have taken place, what has happened to the equilibrium market price, the number of firms operating in the market, and the representative firm's profits? Why?
Definitions:
Public Company Accounting Oversight Board
A regulatory body established by Congress to oversee the audits of public companies in order to protect investors and the public interest.
Return on Assets Ratio
An indicator of how profitable a company is relative to its total assets, measuring the efficiency of asset use.
Operating Income
The income produced from the normal operations of a company, subtracting operating expenses from gross profit.
Average Total Assets
A measure used to evaluate a company's efficiency and profitability, calculated by averaging the total assets at the beginning and end of an accounting period.
Q45: Explain why X-inefficiency is likely to be
Q46: In the case of Matsushita v. Zenith,
Q61: In the case of a short-run production
Q62: The falling phase of a business cycle
Q67: All of the following are cited as
Q68: When calculating the price elasticity of demand,
Q74: The money supply consists of:<br>A) currency plus
Q85: Spending on the structures, equipment, and software
Q86: Institutions that accept deposits from individuals and
Q96: Economists recognize what is sometimes referred to