The following diagram shows the demand and marginal revenue curves facing a foreign monopoly supplier of a good to the home country, as well as the firm's horizontal marginal cost curve when there is no tariff by the home country (MC) and the marginal cost curve when a specific tariff is imposed by the home country (MC + T) . (Assume that average cost (AC) equals marginal cost.) In this situation, the price to home country consumers after the tariff has been imposed is __________.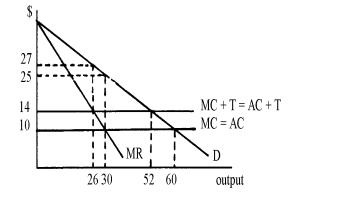
Definitions:
Circular Flow
A model that illustrates the movement of goods, services, and money among households, businesses, government, and the foreign sector in an economy.
Leakages
In economics, it refers to the withdrawal of potential spending from the economy's circular flow, primarily through savings, taxes, and imports.
Household Production
The creation of goods and services by individuals or families within a home environment, not for formal market exchange.
Gross Domestic Product (GDP)
The complete market or financial worth of every finished good and service made within a nation's frontiers in a certain timeframe.
Q5: How do sky waves propagate?<br>Sky waves bounce
Q7: <br>Other things equal, an increase in
Q7: Most instances of encopresis are caused by….<br>A)
Q10: Suppose that, from an initial individual consumer
Q11: Suppose that, in Year 1, the price
Q13: The Treatment for Adolescents with Depression Study
Q18: In a Ricardo-type model, if Portuguese workers
Q20: As a country moves from autarky to
Q23: When considering the change in price of
Q24: A 1974 empirical study (by Steven Rosefielde)