In its 2000 report, a company presented the following data regarding its sales (in millions of dollars), and net income (in millions of dollars).
 The bar chart below was used to present these data.
 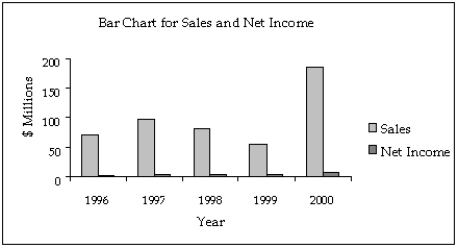 Assume that you are an unscrupulous statistician and want to make the data appear more positive than they really are.Redraw the graph by being selective about which years to include, getting the desired effect.
Definitions:
Q3: Numbers can be added if they are
Q21: When there are four or more categories
Q24: There are two basic types of variance.They
Q34: _ sampling is particularly useful when it
Q41: The relationship between two interval variables is
Q83: For which type of data are the
Q134: Suppose X has a normal distribution with
Q165: Which of the following measures of variability
Q176: {Teachers Ages Narrative} Draw a frequency histogram
Q212: Which of the following statements is true