Use the following to answer question: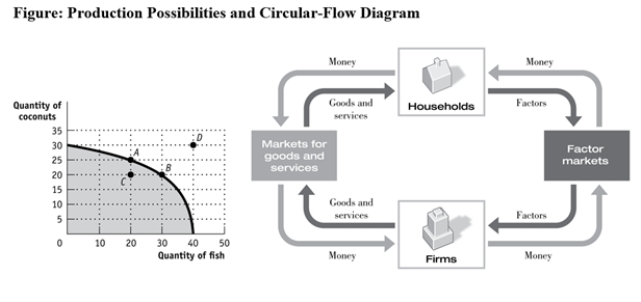
-(Figure: Production Possibilities and Circular-Flow Diagram) Use Figure: Production Possibilities and Circular-Flow Diagram.Assume the two figures represent the same economy.Suppose that in the circular-flow diagram there is a significant decrease in the amount of labor flowing to the firms that produce coconuts.If all other variables remain unchanged,this adjustment in the economy would be BEST represented in the production possibilities figure by a move from point A toward:
Definitions:
Q1: A financial investor from Los Angeles purchases
Q47: A floating exchange rate:<br>A) retains the ability
Q56: Suppose that the United States and European
Q79: A major input into vanilla ice cream
Q203: Which group would supply euros in the
Q212: (Figure: Comparative Advantage) Use Figure: Comparative Advantage.
Q218: Why did China add $2 trillion to
Q228: (Table: Coffee and Salmon Production Possibilities II)
Q267: A fixed exchange rate: I. makes monetary
Q379: The Venezuelan bolivar trades at a fixed