Use the following to answer questions
This figure depicts the typical relation found between a person's age (in years) and his or her reaction time in a simple reaction time task (e.g., time to press a button when a light turns green) .
Figure: Age and Reaction Time 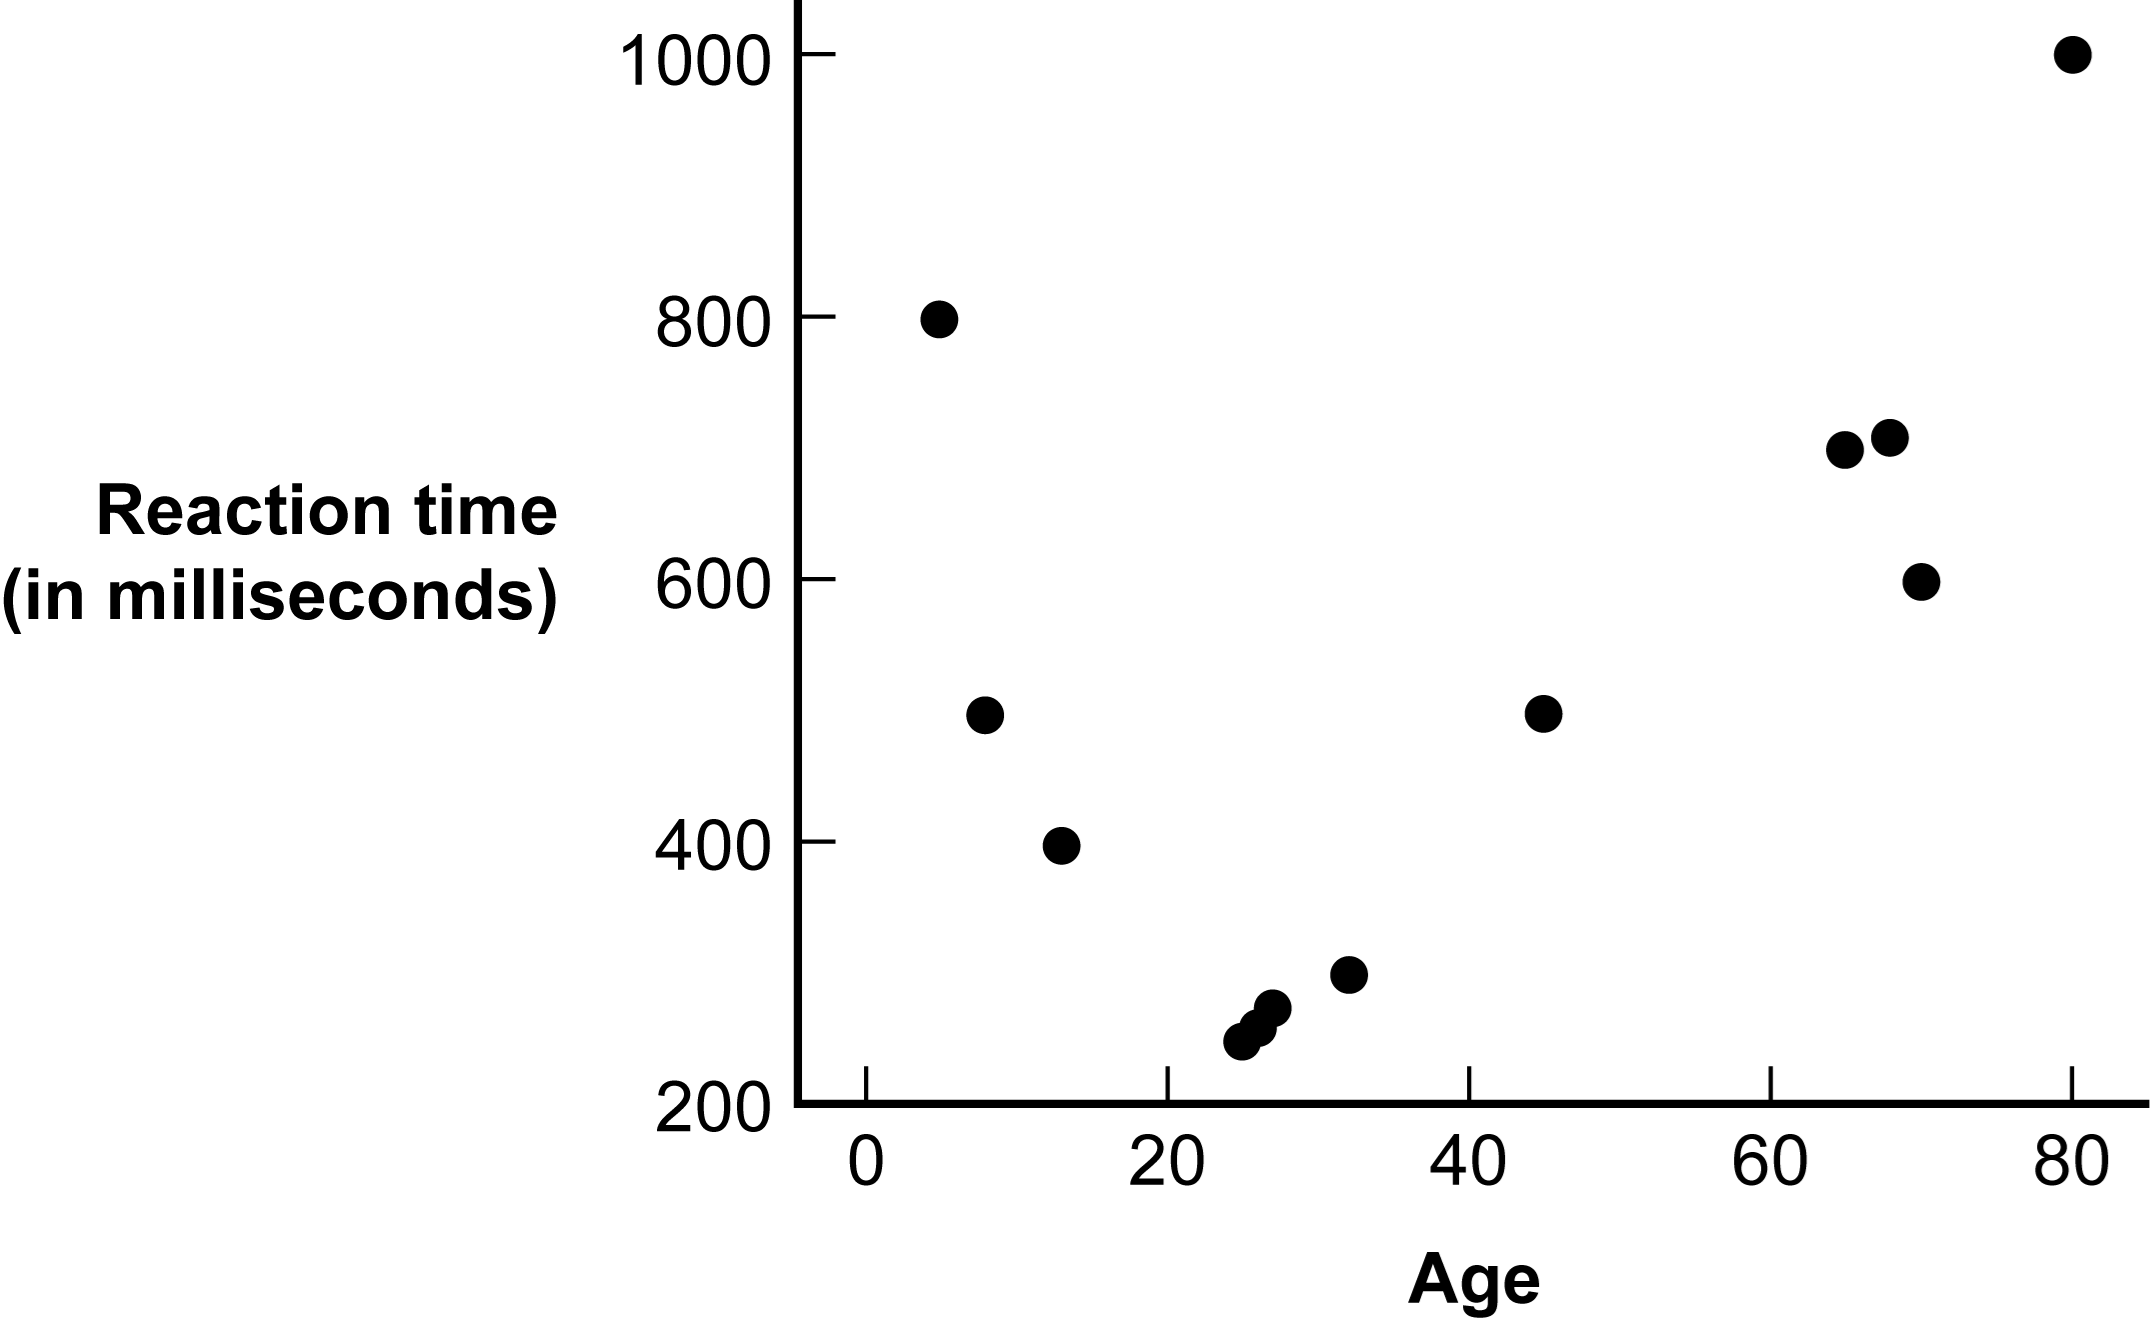
-(Figure: Age and Reaction Time) Which statement best captures what the graph depicts?
Definitions:
Essential Goods
Products that are necessary for basic living and well-being, often unchanged by changes in income.
Nonessential Goods
Products and services considered as non-critical for survival or basic living standards.
Substitution Effect
The change in consumption patterns due to a change in the relative prices of goods, leading consumers to replace more expensive items with cheaper ones.
Relative Price
Relative Price is the price of one good or service compared to another, usually reflecting its value in terms of another item rather than its absolute price in currency.
Q27: When constructing a frequency table, the first
Q28: On a histogram the x-axis depicts the
Q32: Normal distributions are nonsymmetric and inherently have
Q39: Kurt is presenting data on how often
Q70: Positively skewed distributions often result from:<br>A) a
Q75: Raw data are scores that have been
Q81: The statement, "It is hypothesized that participants
Q87: The symbol for the population standard
Q87: A normal distribution is _, while a
Q108: The purpose of a graph is to