Use the following to answer questions
This table and figure depict the average SAT scores for entering freshmen in the year 1995 at 36 North Carolina colleges.
Figure: Histogram of SAT 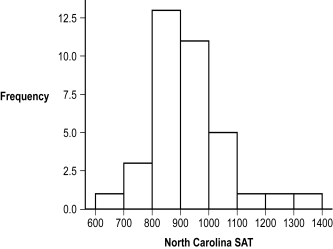
-(Figure: Histogram of SAT) What seems to be the shape of the distribution represented in this histogram?
Definitions:
SST
In the context of statistical analysis, often stands for Sum of Squares Total, which measures the total variation within a data set.
Determination
In statistics, determination often refers to the coefficient of determination, which measures the proportion of variance in a dependent variable predictable from an independent variable.
Estimated Regression
A statistical method used to predict the value of a dependent variable based on the values of one or more independent variables.
SSR
Sum of Squares due to Regression, a measure in statistics used to quantify the variance explained by a regression model.
Q2: When looking at a distribution of data
Q12: A college instructor is interested in whether
Q17: People who report "married" as their relationship
Q46: To quantify the strength of association between
Q68: To determine the critical cutoff for Mann-Whitney
Q69: The x-axis of a bar graph indicates
Q76: A z score allows assessment of the
Q77: According to the text, a good statistician
Q80: You want to predict your score on
Q133: Researchers who study the process of reading