Use the following to answer questions
The scatterplot and regression line on the left depict the relation between a state's expenditure per student and the average SAT scores for students in the state.The scatterplot and regression line on the right depict the relation between students' SAT Verbal and SAT Quantitative scores.
Figure: Standard Error Comparisons 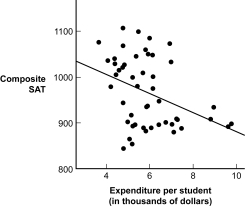
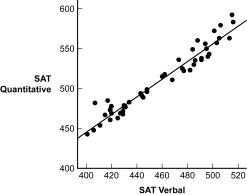
-(Figure: Standard Error Comparisons) Based on the scatterplots, for which prediction is the r2 greater?
Definitions:
Wikis
Collaborative websites that can be edited by multiple users, often used for information sharing and collaborative documentation.
Real-Time Chat
An online communication tool allowing participants to exchange messages instantaneously.
Instant Messaging
A method of real-time text-based communication between two or more people over the internet or a network.
Software Program
A set of instructions or code executed by a computer to perform specific tasks or functions.
Q9: Which of these is an example of
Q11: (Figure: Histogram of SAT) What seems to
Q34: When using bootstrapping to create a confidence
Q41: It would be preferable to have a
Q79: In a two-way ANOVA, three _ statistics
Q84: The regression line is the line that:<br>A)
Q86: The intercept is the predicted value for
Q89: A graph of floral growth as a
Q100: The standardized regression coefficient, which is equal
Q103: At major research institutions, the intense pressure