Exhibit 9.1
The following questions are based on the problem description and spreadsheet below.
A company has built a regression model to predict the number of labor hours (Yi) required to process a batch of parts (Xi). It has developed the following Excel spreadsheet of the results. 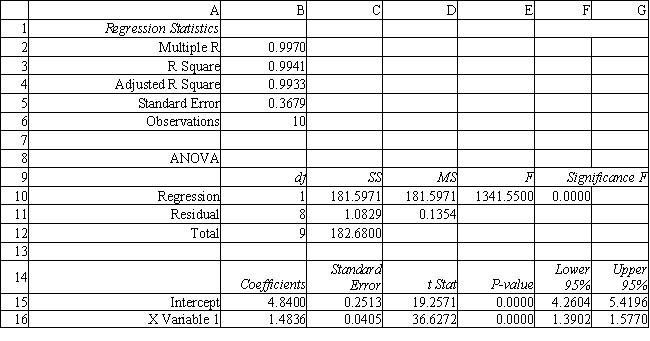
-Refer to Exhibit 9.1. Test the significance of the model and explain which values you used to reach your conclusions.
Definitions:
Cognitive Theorists
Scholars and psychologists who study the mental processes such as perception, memory, thought, and problem-solving, emphasizing how individuals acquire, process, and store information.
Depressive Symptoms
Indicators of depression such as persistent sadness, loss of interest in activities, changes in appetite or sleep, and feelings of worthlessness.
Causal Arrow
A concept used to denote the direction of cause and effect in studies and theories.
Negative Schema
Cognitive frameworks or beliefs that lead individuals to view themselves, others, and the world in a pessimistic or detrimental light.
Q2: Refer to Exhibit 14.10. The original payoff
Q4: Refer to Exhibit 13.4. Based on this
Q6: Why do we create a scatter plot
Q10: Refer to Exhibit 10.6. Compute the discriminant
Q14: Simulation is used to<br>A) find possible worst
Q26: A farmer is planning his spring
Q30: Consider modeling a warehouse with three in-flow
Q31: A company wants to purchase large
Q32: A weakness of Gantt charts is that
Q53: A simulation model was replicated 100 times