Exhibit 13.7
The following questions refer to the information and output below.
A tax accountant has found that the time to serve a customer has a mean of 30 minutes (or 0.5 hours) and a standard deviation of 6 minutes (or 0.1 hours). Customer arrivals follow a Poisson distribution with an average of 60 minutes between arrivals. The following queuing analysis spreadsheet was developed from this information. 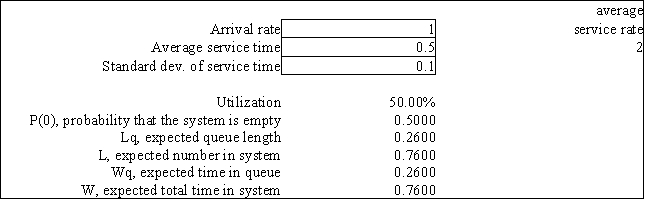
-Refer to Exhibit 13.7. Based on this report how long does a customer spend at the tax accountant's office?
Definitions:
Q18: The spreadsheet model for Sal, from
Q28: Refer to Exhibit 14.10. Complete the following
Q29: In analytical queuing models, the calling population
Q31: When the number of arrivals per unit
Q39: The usual range of the smoothing constant
Q47: One of PERT's bold assumptions is that<br>A)
Q49: _ is not a reason for outsourcing
Q68: The problem of finding the optimal values
Q85: Refer to Exhibit 11.21. What is the
Q97: How are states of nature assigned probabilities?<br>A)