Multiple Choice
Refer to the following figure:
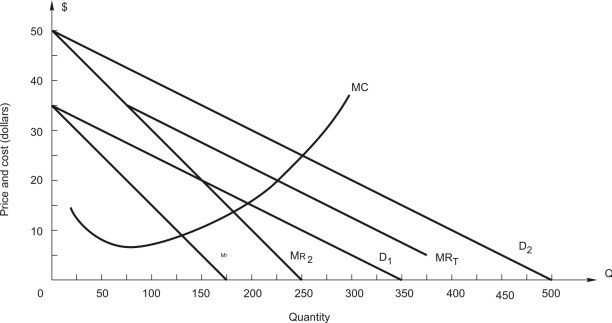
The graph shows the demands and marginal revenue in two markets, 1 and 2, for a price discriminating firm along with total marginal revenue, MRT, and marginal cost.
-How should the firm allocate sales between the two markets?
Definitions:
Related Questions
Q1: At 20 units of labor, what is
Q11: If the condition in the question above
Q23: If the capital stock is fixed at
Q27: Suppose the marketing director ignores the nighttime
Q34: The marginal rate of technical substitution is<br>A)
Q34: An individual is planning to set-up an
Q40: Using the maximax rule, the decision maker
Q50: Which distribution is more risky?<br>A) Distribution 1
Q98: If capital is fixed at three units,
Q144: Held-to-maturity securities are:<br>A) Always classified as long-term