Refer to the following figure:
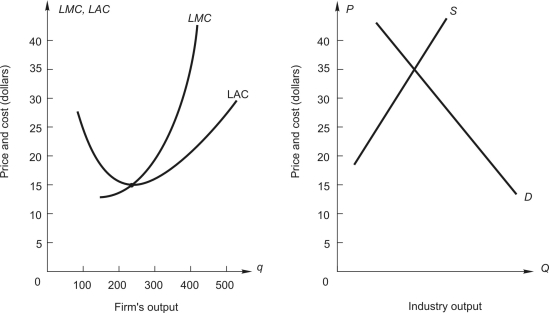
The graph on the left shows long-run average and marginal cost for a typical firm in a perfectly competitive industry. The graph on the right shows demand and long-run supply for an increasing-cost industry.
-If this were an increasing cost industry, what would be the price when the industry gets to long-run competitive equilibrium?
Definitions:
Relatively Elastic
Refers to a situation where the quantity demanded or supplied of a good changes significantly in response to changes in price.
Percentage Increase
calculates the rate at which a quantity grows over a period, expressed as a fraction of its original value.
Elastic
Describes a scenario where a small change in price leads to a large change in quantity demanded or supplied.
Inelastic
describes a situation where the demand or supply for a good is not significantly affected by changes in price.
Q12: How many units of X will the
Q18: The marginal cost function is:<br>A) SMC =
Q27: Suppose that 25 units of X and
Q36: What is the price per unit of
Q41: What is the new own price elasticity
Q42: Which of the follow is NOT a
Q46: A firm with market power<br>A) can increase
Q80: In the table above, what is the
Q91: How many units of labor should the
Q93: When the firm uses 120 units of