The following graph shows 2 isocost curves for a firm. The price of capital is $200. 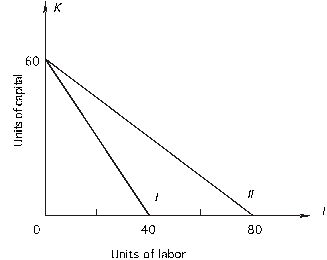
a. The total cost associated with isocost I is $_________, and the price of labor is $_________.
b. The equation for isocost I is _____________________. With isocost I the firm must give up ______ units of capital to purchase one more unit of labor in the market.
c. The total cost associated with isocost II is $_________, and the price of labor is $_________.
d. The equation for isocost II is _____________________. With isocost II the firm must give up ______ units of capital to purchase one more unit of labor in the market.
Definitions:
Acknowledgment Message
A communication sent to confirm receipt of a message or document, often indicating that further action may be taken.
Credit Information
Records or data related to the borrowing and repayment history of an individual or entity, used by lenders to determine creditworthiness.
Maslow's Hierarchy
A theory in psychology proposed by Abraham Maslow, structured as a pyramid with the most fundamental needs at the bottom and the need for self-actualization at the top.
Consumer Needs
The recognized necessities or desires that prompt individuals to purchase products or services.
Q4: At a price of $1, the point
Q9: Which of the following is an example
Q11: If the condition in the question above
Q35: The firm should _ because _.<br>A) shut
Q37: Why wouldn't the firm choose to produce
Q48: Ronald, who consumes only hamburgers and hot
Q54: Using the estimation results given above, the
Q62: Which of the following would indicate a
Q64: A monopoly is producing a level of
Q108: When the firm uses 6 units of