Use the following graph showing the marginal benefit and marginal cost curves for activity A to answer the following questions. 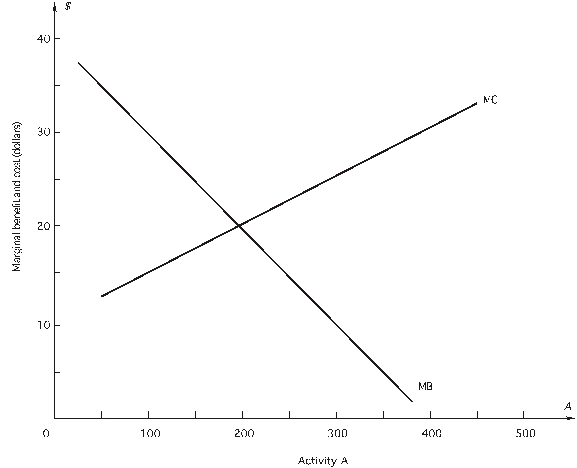
a. Net benefit is maximized when _________ units of A are chosen; marginal benefit is $_________ and marginal cost is $_________.
b. If 300 units of A are chosen, net benefit will increase by $_________ if one _________ unit of A is used.
c. If 100 units of A are chosen, net benefit will increase by $_________ if one _________ unit of A is chosen.
Definitions:
Expected Market Rate
The anticipated return that investors predict they will receive from an investment in the financial markets.
Systematic Risk
The risk associated with market fluctuations that cannot be mitigated through diversification, affecting all investments across the board.
Relevant Risk
The portion of an investment's risk that cannot be eliminated through diversification, also known as systematic or market risk.
Market Portfolio
A theoretical portfolio of all assets in the market, with each asset weighted according to its market capitalization.
Q9: Over the price range $90 to $110,
Q9: Which of the following statements concerning the
Q19: The government-wide statement of net position would
Q23: In the government-wide statements, business-type activities include<br>A)
Q24: the next three years, a firm is
Q24: The line item, net assets released from
Q28: Sources of generally accepted accounting principles for
Q68: If a firm is producing a given
Q76: In the figure above, what is the
Q97: When the firm uses 120 units of