The graph shows the numbers of performers who were elected to the Rock and Roll Hall of Fame from 1991 through 2008.Describe any trends in the data.From these trends, predict the number of performers elected in 2009. 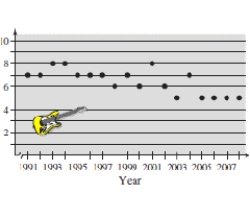
Definitions:
Persuasion
The act of convincing someone to do or believe something through reasoning or the use of appeals.
Cognitive Dissonance
The discomfort in one's mind occurring when they simultaneously hold multiple opposing beliefs, ideas, or values.
Deliberate Attempt
A planned and intentional action aimed at achieving a specific outcome.
Expertise
An extensive amount of background knowledge that is relevant to a reconstructive memory task.
Q100: Use synthetic division to divide. <br>
Q127: Determine which of the following point lies
Q201: Select the graph of the given function
Q291: Find all zeros of the function f(x)
Q306: Find domain of the following function.<br>
Q318: You purchase a house for $250,000.The depreciated
Q375: Find the graph of the equation. <br>F
Q405: Which set of ordered pairs represents a
Q406: Find the domain of <span
Q423: Use long division to divide.<br>