The graph shows the sales (in billions of dollars) for Apple Inc.for the years 2001 through 2007. 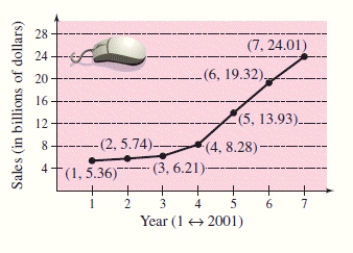 Find the slope of the line segment connecting the points for the years 2003 and 2004.Round the answer to two decimal places.
Definitions:
Last 20 Years
Refers to the most recent two decades, a common time frame for analyzing changes and trends in economic, social, or technological domains.
Disposable Income
Net income available to households after taxes and other deductions, used for spending or saving.
GDP
GDP represents the sum total of all monetary values of goods and services produced inside a nation's boundaries over a given time frame.
Trillion
A numerical value representing one thousand billion, or 10^12 in the United States and other countries using short scale numbering.
Q6: Which of the following is not considered
Q76: Solve the inequality and graph the
Q79: Use the graph, which shows the average
Q148: Determine the quadrant(s) in which (x, y)
Q186: Evaluate f(-7) if f(x) = 12x -
Q197: Find (f + g)(x).<br> <span
Q202: Use the intercept form to find
Q364: the solution set of the
Q401: Find the domain of <span
Q500: Find the difference quotient and simplify