TABLE 2- 3
Every spring semester, the School of Business coordinates a luncheon with local business leaders for graduating seniors, their families, and their friends. Corporate sponsorship pays for the lunches of each of the seniors, but students have to purchase tickets to cover the cost of lunches served to guests they bring with them. The following histogram represents the attendance at the senior luncheon, where X is the number of guests each student invited to the luncheon and f is the number of students in each category.
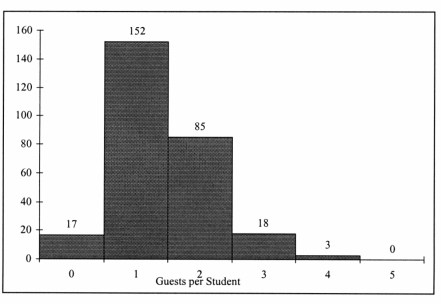
-Referring to the histogram from Table 2- 3, how many graduating seniors attended the luncheon?
Definitions:
Postage
The cost associated with sending letters and parcels through the postal system, typically paid by purchasing stamps or printed labels.
Entertainment
Activities or performances designed for the enjoyment, amusement, or relaxation of an audience, such as movies, music, or sports.
Petty Cash Fund
A small pool of funds held for the purpose of settling small, miscellaneous bills immediately.
Miscellaneous Expense
Minor and irregular costs that do not naturally fit into other designated categories of expenses in financial accounting.
Q3: Referring to Table 17-6, how many possible
Q17: The amount of juice that can be
Q30: Referring to Table 3-2, the five-number summary
Q35: Which of the following is not one
Q47: Referring to Table 4-7, the probability that
Q67: Referring to Table 18-6, a p control
Q91: Referring to Table 17-2, what is the
Q116: Blossom's Flowers purchases roses for sale for
Q124: Referring to Table 17-5, what is the
Q170: Referring to Table 2-13, if a frequency